Graph widget instance GRAPHINST command
Commands in this namespace document operations accepted by graph, barchart, stripchart, and polar widget instances.
GRAPHINST is used below as a placeholder for the actual widget command:
graph .g
.g configure -title "Example"
The same widget instance interface is shared by all four graph types. The main difference is the default
element type used by the element operation.
Widget created by |
Default element type |
|---|---|
|
line |
|
bar |
|
strip |
|
polar |
Explicit line and bar operations are also available independently of the widget’s default element type.
Graph widgets contain several components with their own command interfaces:
Operation |
Component |
|---|---|
|
virtual axes |
|
axes mapped to graph margins |
|
elements of the widget’s default type |
|
line elements |
|
bar elements |
|
graph markers |
|
drawing pens |
|
graph legend |
|
graph grid |
|
interactive crosshairs |
|
PostScript output |
|
SVG output |
These component interfaces are documented separately.
Margins
The graph has four margins surrounding the plotting area. Their sizes are normally calculated automatically from axes, axis titles, tick labels, the graph title, and the legend.
The margin options:
-bottommargin
-leftmargin
-rightmargin
-topmargin
override the automatically calculated size when set to a positive screen distance. Setting a margin size to 0
restores automatic sizing.
The corresponding options:
-bottomvariable
-leftvariable
-rightvariable
-topvariable
can be used to observe the actual calculated margin sizes. After layout and drawing, Rbc writes the current size of each configured margin to the specified global Tcl variable.
For example:
graph .g -leftvariable leftSize -bottomvariable bottomSize

pack .g -fill both -expand yes
update idletasks

puts "left margin: $leftSize"
puts "bottom margin: $bottomSize"
Plotting area
The outer graph background and the plotting-area background are configured independently.
graph .g -background grey90 -plotbackground white -plotrelief sunken -plotborderwidth 2
-plotpadx and -plotpady add space immediately around the plotting surface. Each option accepts either one
distance:
.g configure -plotpadx 10
or two distances for the two sides:
.g configure -plotpadx {5 15}
.g configure -plotpady {10 20}
Aspect ratio
A positive -aspect value constrains the plotting area to a requested width-to-height ratio.
For example:
.g configure -aspect 1.0
requests a square plotting area, while:
.g configure -aspect 1.5
requests a plotting area whose width is 1.5 times its height.
Rbc satisfies the requested ratio by reducing the usable width or height of the plotting area; it does not
enlarge the widget. Set -aspect to 0 to disable the constraint.
Layout
For simple cartesian graph without legend and with all default axes shown, example of layout and corresponding dimensions:
set graph [graph .g -width 600 -height 600]
$graph configure -plotpadx 20 -plotpady 20 -title {Title example} -plotborderwidth 5 -plotrelief sunken

$graph axis configure x -hide no -title {x axis}
$graph axis configure y -hide no -title {y axis}
$graph axis configure x2 -hide no -title {x2 axis}
$graph axis configure y2 -hide no -title {y2 axis}

grid $graph -row 0 -column 0
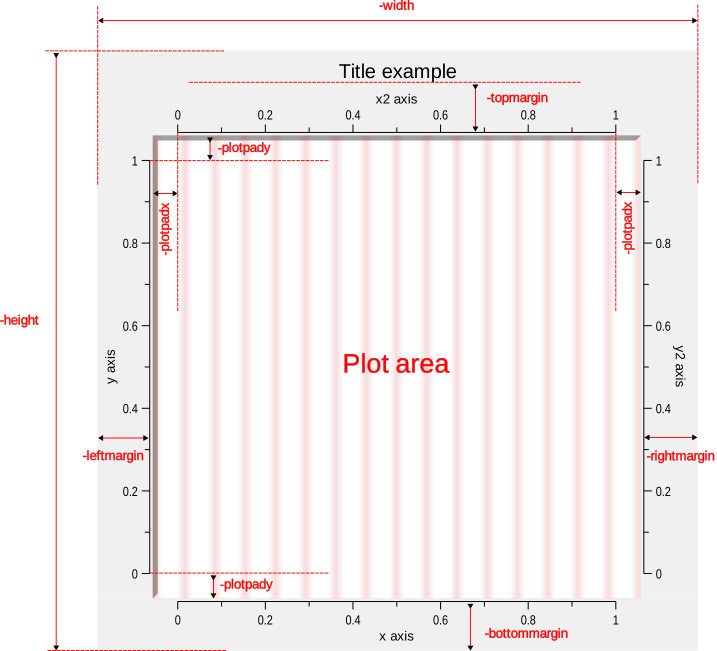
Coordinate systems
Graph widgets use two coordinate systems:
graph coordinates are the numeric data values represented by the axes
window coordinates are pixel positions within the widget.
The transform operation converts graph coordinates to window coordinates, while invtransform performs the
reverse conversion.
The general transform and invtransform operations use the graph’s primary X and Y axes. To transform a
value using a particular axis, use that axis’s transform or invtransform operation.
Polar and Smith charts
A widget created with ::rbc::polar uses the ordinary Rbc graph coordinate system but provides specialized Polar and Smith-chart grid representations.
Polar data are always represented internally as Cartesian coordinates:
x = real
y = imaginary
The -representation option changes the grid and associated labels; it does not reinterpret ordinary X/Y
element data as radius/angle pairs.
For example:
polar .p -representation polar

.p element create trace -data {1 0 0.5 0.5 0 1 -0.5 0.5}
The same Cartesian coordinates may be displayed with a Smith grid:
.p configure -representation smith
Automatic equal-unit aspect
Polar and Smith geometry requires equal physical scaling of the Cartesian X and Y dimensions. Otherwise a circle in the complex plane would be displayed as an ellipse.
A newly created polar widget therefore uses automatic equal-unit aspect handling when -aspect has not been
explicitly supplied. The nominal value returned by:
.p cget -aspect
is 1.0, but the physical plotting-area width-to-height ratio is automatically derived from the current
numerical spans of the grid’s mapped X and Y axes.
For example, with:
X range = -3.5 .. 1.3     span = 4.8
Y range = -1.5 .. 1.5     span = 3.0
the plotting area is made approximately 4.8 / 3.0 = 1.6 times wider than it is high. One X unit and one Y
unit therefore occupy the same number of pixels and the Smith unit circle remains circular.
This automatic calculation follows the axes selected by:
.p grid configure -mapx axisName -mapy axisName
and is recalculated if those mappings or axis ranges change.
Supplying -aspect explicitly selects the normal fixed plotting-area aspect semantics instead:
polar .p -aspect 1.0
An aspect supplied through the Tk option database is likewise considered explicit. With an explicit aspect, unequal numerical X and Y spans can intentionally distort circles.
-invertxy is supported by automatic equal-unit scaling.
Polar grid
In polar representation, circular radial grid lines are derived from positive ticks of the X axis selected by
grid -mapx. Negative ticks are ignored because radius is unsigned. The zero tick represents the origin rather
than a circle.
The origin does not have to be visible. Rbc draws every configured radial circle that intersects the current plotting area. When only part of a circle lies inside the current Cartesian axis ranges, the visible portion is clipped to the plotting area.
Angular spokes are positive rays starting at the Polar origin. Each configured spoke is clipped independently to the current plotting area. If the origin is outside the visible area, a spoke is still drawn when its positive ray intersects the viewport. A spoke whose positive ray does not intersect the viewport is omitted.
This means that zooming into an arbitrary part of the Polar plane does not remove the Polar grid merely because
(0,0) is no longer visible.
Radial labels use the mapped X axis’s normal major-tick formatting machinery. This means an axis -command
callback can be used to customize radial labels:
proc formatRadius {widget value} {
    if {$value < 0} {
        return {}
    }
    return [format "r=%.2f" $value]
}
.p axis configure x -majorticks {-1 -0.75 -0.5 -0.25 0 0.25 0.5 0.75 1} -command formatRadius
Only positive radial values are candidates for radial labels.
Radial labels are attached to the positive zero-degree ray at:
x = radius
y = 0
The origin itself does not need to be visible. A radial label remains visible whenever its corresponding point on the positive zero-degree ray lies inside the current viewport. If the zero-degree ray is outside the viewport, a radial circle may still be visible while its radial label is omitted.
Angular spokes are controlled separately from axis ticks. Major angular spokes come from
-anglemajorticks; minor angular spokes come from -angleminorticks when:
.p grid configure -minor yes
Only major angular ticks receive labels.
The default major angular ticks are:
0 30 60 90 120 150 180 210 240 270 300 330
and the default minor angular ticks are:
15 45 75 105 135 165 195 225 255 285 315 345
Angular labels use degrees. The built-in formatter appends the degree sign.
Angular-label placement adapts to the current viewport.
When a complete circle centered at the origin fits inside the plotting area, major angular labels are arranged on the normal circular label locus inside that circle.
When no complete centered circle is visible, each major angular label is instead placed at the far visible end of its clipped spoke. If the corresponding positive ray does not intersect the viewport, neither that spoke nor its angular label is displayed.
With -anglelabelanchor auto, Rbc chooses an inward-facing anchor from the actual label position. For clipped
spokes this is based on the mapped screen direction, so the behavior also follows -invertxy.
-anglecommand replaces the built-in angular label formatter. Its value is a Tcl command prefix. Rbc appends:
widgetPath degrees
where degrees is the configured numeric angular-tick value without a degree suffix.
For example:
proc formatAngle {widget degrees} {
    return [format "%g deg" $degrees]
}
polar .p -anglemajorticks {0 45 90 135 180 225 270 315} -anglecommand formatAngle
The callback result is used as the complete label. Returning an empty string suppresses that label.
If an angular formatter raises an error while the graph is being drawn, the error is reported as a background Tcl error and Rbc keeps the built-in label for that tick.
-anglelabelanchor and -radiallabelanchor control label placement. They accept the normal Tk anchor values
and the special value auto. Automatic angular anchoring keeps labels directed inward from their circular or
clipped-spoke positions. Automatic radial anchoring uses the standard radial-label placement.
Polar autoscaling without visible elements
Plot-hidden and normally hidden elements do not contribute to automatic axis limits.
For a Polar representation, if a grid-mapped axis has no contributing visible element data, Rbc supplies a
neutral -1 to +1 fallback range for that axis. This keeps an empty Polar widget, or a Polar widget whose
plotted elements have all been hidden with -hideplot, in a usable state with a visible Polar grid.
The fallback is used only when that grid axis has no visible data contribution. It does not constrain or extend an axis whose range is already determined by visible element data.
When a hidden element is made visible again, normal data-driven autoscaling resumes.
Smith representation
Smith representation is selected with:
polar .p -representation smith
The Smith grid is drawn in reflection-coefficient coordinates, Gamma. The unit circle is a reference grid; it
is not a clipping boundary. Data with |Gamma| > 1, such as data representing negative resistance, may be
displayed when the axis ranges include those values.
-smithgrid controls the domain of the displayed contours:
impedance
admittance
both
The default is impedance.
The impedance and admittance contours use normalized values. Major contour values determine both grid lines
and labels. Minor contour values are drawn only when the grid’s -minor option is enabled.
The default real contour values are:
major: 0 0.2 0.5 1 2 5
minor: 0.1 0.3 0.7 1.5 3 10
The default imaginary contour magnitudes are:
major: 0.2 0.5 1 2 5
minor: 0.1 0.3 0.7 1.5 3 10
Real contour values must be finite and non-negative. Zero is permitted. Imaginary contour values specify positive magnitudes, must be finite and greater than zero, and generate both positive and negative reactive contours.
Empty tick lists suppress the corresponding contour class.
For example:
.p configure -smithrealmajorticks {0 0.25 0.5 1 2 5 10} -smithrealminorticks {0.1 0.75 1.5 3} -smithimagmajorticks {0.25 0.5 1 2 5} -smithimagminorticks {0.1 0.75 1.5 3}
Smith labels during zooming
Major imaginary Smith labels normally appear near the unit-circle end of their corresponding reactance or susceptance contours.
When the complete Smith unit circle is visible, Rbc retains this normal placement slightly inside the unit circle.
When the current axis ranges show only part of the Smith chart, Rbc follows each major reactive contour from
its zero-resistance or zero-conductance end and finds the first part of that contour which intersects the
viewport. The corresponding +jx, -jx, +jb, or -jb label is placed at that visible contour boundary
instead.
If a reactive contour does not intersect the visible viewport, its label is omitted.
The fallback placement uses the actual mapped contour direction to choose an inward-facing text anchor. It
therefore works with -invertxy and with impedance, admittance, and combined Smith grids.
Real resistance and conductance labels retain their normal Smith-chart positions.
The same adaptive placement is used for on-screen rendering and PostScript output.
Custom Smith labels
-smithrealcommand and -smithimagcommand are Tcl command prefixes used to format major Smith labels.
Rbc appends three arguments:
widgetPath domain value
domain is either impedance or admittance.
For -smithrealcommand, value is the non-negative normalized resistance or conductance value.
For -smithimagcommand, value is signed and represents normalized reactance or susceptance.
For example:
proc formatSmithReal {widget domain value} {
    if {$domain eq "impedance"} {
        return [format "r=%g" $value]
    }
    return [format "g=%g" $value]
}

proc formatSmithImag {widget domain value} {
    if {$domain eq "impedance"} {
        return [format "x=%+g" $value]
    }
    return [format "b=%+g" $value]
}

polar .p -representation smith -smithgrid both -smithrealcommand formatSmithReal -smithimagcommand formatSmithImag
Returning an empty string suppresses that label.
A formatter error raised during drawing is reported as a background Tcl error and the normal built-in label is retained.
The same formatter callbacks and label strings are used for window drawing and PostScript output.
Polar/Smith mapped axes
The Polar and Smith grids use the X and Y axes selected by the grid component:
.p grid configure -mapx x2 -mapy y2
Elements may independently be mapped to matching alternate axes:
.p element create trace -cdata gamma -mapx x2 -mapy y2
Changing the grid-axis mapping also recalculates automatic equal-unit aspect handling.
Limitations and domain rules
Polar and Smith grids require linear Cartesian axes. If either mapped grid axis uses -logscale yes, the
specialized grid and its labels are suppressed.
A conventional Polar grid does not require the origin to be visible. Radial circles are displayed whenever they intersect the current Cartesian viewport, and angular spokes are clipped positive rays from the Polar origin. When the origin is outside the viewport, only spokes whose positive rays cross the visible area are drawn.
Radial labels require their corresponding point on the positive zero-degree ray to be visible. Angular labels use the normal circular layout when a complete centered circle fits inside the viewport; otherwise they are placed at the visible ends of their clipped spokes.
Smith grids do not clip element data to the unit circle.
Polar coordinates supplied through ordinary -data, -x, and -y options are Cartesian X/Y coordinates;
they are not {radius angle} values.
Smoothing does not implicitly close a trace. To draw a closed data loop, include the first point again as the final point.
The step smoothing mode remains Cartesian step-and-hold interpolation. It is not a radial/angular stepping
mode.
Singular impedance or admittance conversions are omitted from the mapped trace and create a real trace break. Smoothing is applied independently to valid continuous runs and never bridges such a gap.
Polar/Smith widget options
These options are meaningful for widgets created with ::rbc::polar.
Option |
Database name |
Database class |
Description |
|---|---|---|---|
|
|
|
Sets the anchor used for major angular labels. Accepts a Tk anchor or |
|
|
|
Specifies a Tcl command prefix for formatting major angular labels. Rbc appends |
|
|
|
Specifies major angular spokes and labels in degrees. The default is |
|
|
|
Specifies minor angular spokes in degrees. They are drawn when |
|
|
|
Sets the anchor used for Polar radial labels on the positive zero-degree ray. Accepts a Tk anchor or |
|
|
|
Selects |
|
|
|
Selects |
|
|
|
Specifies a Tcl command prefix for major real Smith labels. Rbc appends |
|
|
|
Specifies a Tcl command prefix for major imaginary Smith labels. Rbc appends |
|
|
|
Specifies non-negative normalized real values for major Smith contours and labels. Default: |
|
|
|
Specifies non-negative normalized real values for minor Smith contours. Default: |
|
|
|
Specifies positive normalized imaginary magnitudes for major Smith contours and labels. Default: |
|
|
|
Specifies positive normalized imaginary magnitudes for minor Smith contours. Default: |
Rendering backend
-renderer native|cairo selects the screen renderer. Builds configured with --enable-cairo default to
cairo; builds without Cairo default to native. Explicit options override option-database defaults.
Its option-database name is renderer and its class is Renderer.
Cairo is optional and requires a build configured with --enable-cairo.
Requesting cairo from a build without Cairo support returns an error.
graph .g -renderer cairo
.g element create signal -data {0 0 1 2 2 1} -symbol none
.g configure -renderer native
Cairo draws solid and dashed line traces, strip segments, geometric symbols, line/strip error bars, and solid, stippled, or photo-tiled line areas. Active traces and symbols use Cairo too. Grid lines, non-XOR line markers (including arrowheads), and polygon markers also use Cairo. Mapping, decimation, and point selection remain shared with native rendering.
Supported symbols are circle, square, diamond, plus, cross, splus, scross,
triangle, and arrow. Their size, fill, outline, and -maxsymbols settings are preserved.
Symbols remain partially visible at plot edges, including when their centers are outside.
Fill passes precede outline passes, using bounded batches.
Error bars retain their color, cap geometry, and -showerrorbars settings. They are solid,
independent of trace dashes. A zero error-bar width retains the native one-pixel hairline.
Line areas use the existing mapped polygon and even-odd fill rule. Stipples repeat from the
widget origin, with crisp pattern pixels and antialiased polygon edges. An empty
-areabackground leaves stipple gaps transparent; a color paints them. Solid fills use
-areaforeground. Areas are drawn before the line’s traces, error bars, and symbols.
Photo tiles repeat from the toplevel window origin, matching native tile alignment.
Their pixels remain sharp; -antialias controls polygon edges. Cairo composites photo alpha,
including partially transparent pixels, against the existing graph contents. Native tiles retain
their existing transparency-mask behavior. Image edits invalidate the cached element image.
Bar elements use Cairo for solid/stippled fills and error bars, including active bars and named pens. Existing bar modes, baselines, axes, and selection mapping are shared with native rendering. Mapped rectangles retain crisp integer edges. Stipples retain their widget origin and transparent or colored gaps. Tk relief borders and value labels remain native.
Legend line/strip samples, geometric symbols, and bar swatches also use Cairo, including external legends. Swatch stipples restart at the sample origin. Legend text, backgrounds, and borders retain native drawing. Samples use the normal pen and do not consume plot symbol limits.
Axis lines and tick marks use Cairo with the existing color, width, and projecting caps.
They draw across the widget margins, independently of the plot clip. Axis labels, titles, and relief
backgrounds remain native. A zero axis -linewidth hides strokes, as with native rendering.
Non-photo image tiles retain native rendering. Empty -areaforeground values use Cairo with the native GC color.
Text-marker backgrounds use Cairo antialiasing and plot clipping, including rotated backgrounds.
All text, window markers, non-photo image markers, and crosshairs retain native rendering.
Grid and marker geometry is clipped to the plotting area. Marker color pairs, stipples, dash offsets,
caps, and under/over ordering are preserved. Mapped segments remain independent, retaining their
existing dash restarts. XOR markers keep native drawing and erase behavior. A line marker with an
empty -outline also uses Cairo with its native GC color.
Symbols smaller than three mapped pixels use Cairo one-pixel fills, sharp in every antialias mode.
As with native drawing, they use only the fill color and bypass -maxsymbols; an empty fill hides them.
Bitmap element symbols and their legend samples use Cairo with existing aspect-preserving scaling
and mask behavior. Pixels stay sharp in every antialias mode. Active pens and -maxsymbols retain
their existing selection rules; legend samples do not consume that limit. The scaled bitmap is
converted once per pen drawing pass and reused for its selected symbols.
Bitmap markers use their existing mapped bitmap and mask with Cairo clipping and color composition.
Scaling, rotation, anchors, offsets, and layer order are preserved. Bitmap pixels stay sharp;
-antialias affects the polygon background of arbitrarily rotated markers. An empty foreground uses Cairo with the native GC color.
Photo image markers also use Cairo. Their existing anchors, offsets, scaling, and layer order are
preserved. Cairo composites photo alpha at the mapped integer position and clips to the plot;
-antialias does not resample image pixels. Source edits, resizing, and deletion refresh the marker.
-antialias default|none|gray|fast|good|best selects antialiasing for Cairo geometry.
Its default is default; its option-database name and class are antialias and Antialias.
Native rendering ignores this option. Changing it invalidates the cached element image.
none disables antialiasing. gray requests coverage antialiasing. fast, good, and best
are backend-dependent quality hints; they need not produce different images. Antialiasing can
vary the apparent brightness of a one-pixel diagonal. A wider line or none can make that
effect less noticeable.
.g configure -renderer cairo -antialias gray
.g element configure signal -dashes {8 4} -offdash red
Dash lengths and offsets use the existing pen values in screen pixels. Phase continues within
each mapped line trace and restarts for each independent strip segment. An empty -offdash
leaves gaps transparent. A color paints the gaps using the existing PostScript underlay
convention; defcolor uses the foreground color and produces a solid stroke.
Two-color strip segments are stroked individually to preserve drawing order at intersections. Solid and single-color strip segments retain batching.
Snapshots use the selected renderer for these primitives. PostScript and Windows metafile output retain their existing exporters. Switching renderers invalidates the cached element image. On Windows, mixed/Cairo marker passes share a temporary DIB drawing target. Existing pixels are copied once into the target and once back; native text and fallbacks retain display-list order. Text-only passes keep native batching. The target is released at the end of each pass, including snapshot rendering. Consecutive compatible solid line and outline-only polygon markers share a Cairo context. Each marker retains a separate stroke so overlapping antialiased edges keep their appearance. Style changes, arrows, dashes, fills, and native drawing end the run. The context is released before the marker pass ends. Native rendering remains the fallback when a Cairo drawing surface cannot be opened.
Widget options
The following options configure the graph widget itself. They are shared by graph, barchart, stripchart,
and polar and may be specified when the widget is created or modified later with GRAPHINST configure.
Some options, such as -barmode, -barwidth, and -baseline, primarily affect bar elements but are available
on all four graph widget types.
Option |
Database name |
Database class |
Description |
|---|---|---|---|
|
|
|
Sets a fixed physical width-to-height aspect ratio for the plotting area when explicitly configured. For graph, barchart, and stripchart the default is |
|
|
|
Sets the background used for the outer graph area and margins. The plotting area has its own |
|
|
|
Controls how bar elements having the same X coordinate are arranged. Valid modes are |
|
|
|
Sets the default width of bar elements in graph-coordinate units. The value must be finite. Values less than or equal to zero are normalized to |
|
|
|
Sets the baseline from which bars are drawn. The value must be finite. The default is |
|
|
|
Sets the width of the 3-D border around the outside of the widget. The appearance of the border is controlled by |
|
|
|
Sets the requested size of the bottom margin. A value of |
|
|
|
Names a global Tcl variable that is updated with the actual size of the bottom margin after graph layout. An empty value disables the variable update. |
|
|
|
Enables caching of the plotted elements in a backing pixmap. This can improve redraw performance when elements remain unchanged while markers, legends, or other overlays are updated. The default is |
|
|
|
Enables double-buffering of the complete graph. When enabled, the graph is first rendered into a pixmap and then copied to the widget window, reducing visible redraw flicker. The default is |
|
|
|
Specifies the mouse cursor displayed over the graph widget. The default is |
|
|
|
Stores application-defined data associated with the graph widget. The graph rendering code does not interpret this value; it may be used by Tcl code or bindings to associate additional information with the widget. |
|
|
|
Stores an application-defined command string associated with the graph. The graph core currently does not invoke this command automatically. |
|
|
|
Specifies the font used for the graph title. |
|
|
|
Specifies the foreground color of the graph title. |
|
|
|
Sets the default maximum screen distance used when searching for a closest data point or element. Operations that provide their own halo value override this setting. The default is |
|
|
|
Specifies the requested height of the graph widget. The default is |
|
|
|
Specifies the color used for the traversal highlight area when the widget does not have keyboard focus. |
|
|
|
Specifies the color used for the traversal highlight when the widget has keyboard focus. |
|
|
|
Specifies the width of the keyboard-focus highlight around the widget. The default is |
|
|
|
Swaps the placement and orientation of the logical X and Y axes. When enabled, X axes are displayed vertically and Y axes horizontally. The default is |
|
|
|
Specifies the justification of multi-line graph title text. Valid values are |
|
|
|
Sets the requested size of the left margin. A value of |
|
|
|
Names a global Tcl variable that is updated with the actual size of the left margin after graph layout. An empty value disables the variable update. |
|
|
|
Specifies the background color of the plotting area. This is independent of the outer |
|
|
|
Sets the width of the 3-D border surrounding the plotting area. Its appearance is controlled by |
|
|
|
Sets horizontal padding around the plotting area. |
|
|
|
Sets vertical padding around the plotting area. |
|
|
|
Specifies the 3-D relief of the plotting area. Valid values are the standard Tk relief values. The default is |
|
|
|
Specifies the 3-D relief of the outer graph widget. Valid values are the standard Tk relief values. The default is |
|
|
|
Sets the requested size of the right margin. A value of |
|
|
|
Names a global Tcl variable that is updated with the actual size of the right margin after graph layout. An empty value disables the variable update. |
|
|
|
Specifies the shadow used when drawing the graph title. An empty value disables the title shadow. |
|
|
|
Controls whether the graph participates in keyboard focus traversal. It has the same interpretation as the standard Tk |
|
|
|
Specifies an image used to tile the background of the graph margins. An empty value disables tiling and uses the normal |
|
|
|
Specifies the graph title. An empty value suppresses the title. |
|
|
|
Sets the requested size of the top margin. A value of |
|
|
|
Names a global Tcl variable that is updated with the actual size of the top margin after graph layout. An empty value disables the variable update. |
|
|
|
Specifies the requested width of the graph widget. The default is |
Tk option database
Graph widgets and their components participate in Tk’s option database.
Every configurable option has three names:
Kind |
Example |
|---|---|
Command option |
|
Database name |
|
Database class |
|
The command option is used with configure and cget:
.g element configure signal -linewidth 2
The database name and database class are used by Tk’s option command:
option add *Graph.signal.lineWidth 2
option add *Graph.Element.LineWidth 2
The first form targets the option by component and database name. The second targets all matching components by resource class and option database class.
RBC uses the same option-database mechanism for graph subcomponents even though most of them are not separate Tk widgets. When a component is initialized, RBC performs option lookup using a temporary child window having the component’s resource name and resource class.
Component resource names and classes
Component |
Resource name |
Resource class |
|---|---|---|
Axis |
axis name, such as |
|
Element |
element name |
|
Pen |
pen name |
|
Bitmap marker |
marker name |
|
Image marker |
marker name |
|
Line marker |
marker name |
|
Polygon marker |
marker name |
|
Text marker |
marker name |
|
Window marker |
marker name |
|
Legend |
|
|
Grid |
|
|
Crosshairs |
|
|
PostScript |
|
|
Thus an option-database entry can target either a whole component class:
option add *Graph.Axis.Color navy
option add *Graph.Element.LineWidth 2
option add *Graph.Pen.Color blue
option add *Graph.TextMarker.Foreground darkgreen
or a particular named component:
option add *Graph.x.color red
option add *Graph.signal.lineWidth 3
option add *Graph.activeLine.color green
option add *Graph.annotation.foreground purple
The graph widget class in these examples is Graph. For barchart and stripchart widgets, use their
corresponding Barchart and Stripchart resource classes.
Named elements, pens, and markers are represented internally as component resource names. For these components,
RBC converts the first character of the object name to lowercase for option-database lookup. For example, an
element named Signal uses the component resource name signal.
When option database values are applied
Option database values are read when a component is initialized. They therefore normally need to be installed before that component is created.
For a dynamically created element:
graph .g
option add *Graph.Element.Color navy
.g element create signal
the new element obtains its initial color from the option database.
To target one particular element:
graph .g
option add *Graph.signal.color red
.g element create signal
.g element create reference
only signal receives that instance-specific value.
Components created automatically with the graph, such as the built-in axes, active pens, legend, grid, crosshairs, and PostScript component, should have their option-database entries installed before the graph widget itself is created:
option add *Graph.Grid.Color grey70
option add *Graph.Legend.Foreground navy
option add *Graph.activeLine.color red
graph .g
Adding an option-database entry later does not reconfigure components that have already been initialized.
Use the component’s configure operation to change an existing object.
Explicit options supplied when an object is created override values obtained from the option database:
option add *Graph.Element.Color navy
.g element create signal -color red
Here signal is red.
Discovering database names and classes
The configure query forms report the exact database name and database class used by an option.
For example:
set info [.g element configure signal -linewidth]
lassign $info optionName databaseName databaseClass defaultValue currentValue
The five values correspond to:
command option
database name
database class
default value
current value
The same technique works for axes, pens, markers, the legend, grid, crosshairs, PostScript, and the graph widget itself.
For example:
.g axis configure x -color
.g pen configure activeLine -color
.g marker configure annotation -foreground
.g legend configure -foreground
.g grid configure -linewidth
.g crosshairs configure -color
.g postscript configure -landscape
Synonym options such as -bg, -fg, and -bd refer to the database name and class of their canonical option.
Some options intentionally have no option-database name or class. Such options can be set only through the
component command. For example, a marker’s -name option is not read from the option database.
Bar modes
The -barmode option determines how bars from different elements are arranged when they use the same X
coordinate.
Mode |
Description |
|---|---|
|
Equivalent to |
|
Draws each successive bar in front of the previous bar. |
|
Stacks successive bars vertically. |
|
Places bars side by side. |
|
Places bars side by side with a small overlap. |
For example:
barchart .b
.b configure -barmode stacked
The -barmode, -barwidth, and -baseline options have no significant effect unless bar elements are present
in the graph.
Buffering
Two separate buffering mechanisms are available.
-buffergraph controls double-buffering of the complete widget. With double-buffering enabled, Rbc renders the
graph to an off-screen pixmap and copies the completed image to the window.
-bufferelements controls an additional backing store containing the plot region and data elements. It is
useful when elements themselves are unchanged but the graph must frequently redraw objects placed above them,
such as markers.
Element buffering is only used when graph double-buffering is also enabled.
For graphs whose element data or axes change very frequently, disabling -bufferelements may avoid maintaining
a cache that cannot be reused.
For example:
.g configure -buffergraph yes -bufferelements no
SVG output
The SVG component exports the complete graph as SVG, independently of the screen renderer and without requiring Cairo. It is available on graph, stripchart, barchart and polar widgets.
.g svg configure -width 1200 -height 800
set document [.g svg output]
.g svg output plot.svg
See ::rbc::SVG for command syntax, options, examples and export limitations.
Named fonts and display scaling
Graph, stripchart, barchart and polar widgets follow changes to named Tk fonts. After font configure,
pending idle work refreshes graph and axis titles, tick labels, legends (including external legends),
text-marker geometry and element value labels. This includes named pens and active pens. No explicit
graph or component reconfiguration is needed.
font create PlotFont -family Helvetica -size 10
.g axis configure x -tickfont PlotFont
.g legend configure -font PlotFont
font configure PlotFont -size 16
update idletasks
Font changes invalidate graph layout and buffered drawing. They do not change data or explicitly configured axis limits. Automatic tick placement can change to fit the new text dimensions.
This notification handles font resources, not automatic resizing of every pixel-valued option.
Explicit pixel sizes remain pixels. Physical screen distances are converted through Tk when configured;
changing tk scaling does not promise to rescale every existing graph option. Configure application
scaling before creating widgets. Toolbar icon and spacing adaptation is separate from this core behavior.
Numeric values and expressions
Expression support is option-specific. The option tables say when a value accepts a Tcl numeric expression, or when each list item accepts one. Integer expressions must produce integer results; numeric expressions may produce floating-point results. The option’s range and domain rules still apply.
Axis limits and explicit ticks, literal element data and error lists, marker coordinates, numeric dash
lists, and the legend’s @x,y position support expressions. Other numeric options do not automatically
evaluate arithmetic. For example, -valueoffset requires two integer pixel values, and crosshair
-position accepts Tk pixel distances rather than the legend’s integer expressions.
Brace an expression to pass it to Rbc without Tcl substituting it first:
.g axis configure x -max {2 * acos(-1)}
.g legend configure -position {@10+5,20+10}
For list options, each expression must be one list item. Use inner braces around expressions containing spaces; the outer braces delimit the entire list:
.g element configure signal -x {0 {1.0 / 3} {2.0 / 3} 1}
.g grid configure -dashes {{2 * 3} {1 + 1}}
Use floating-point operands when a fractional result is needed: 1 / 3 is integer division,
while 1.0 / 3 produces a fraction. Tcl expression functions and substitutions follow normal Tcl
expression rules. Outer braces defer substitution; they do not disable it when Rbc evaluates the expression.
Expressions are evaluated when Rbc parses the option. They are not live formulas: changing a referenced Tcl variable does not itself update the graph. Supply the option again to evaluate it with new values. An existing Rbc vector name supplied to a vector-capable data option is handled as a vector reference, not an expression; vector notifications provide its automatic updates.
For an option that does not evaluate expressions, calculate the value explicitly:
set gap 8
.g element configure signal -valueoffset [list 0 [expr {-$gap - 4}]]
Application data
The -data option is an application-defined storage slot. Rbc stores the supplied value but does not interpret
it in the C graph implementation.
For example:
.g configure -data [dict create source simulation1 quantity voltage]
set graphData [.g cget -data]
-datacommand similarly stores a command string. It is retained as part of the graph configuration interface,
but the current graph core does not automatically execute it.
Graph change notification
Graph, barchart, stripchart, and polar widgets generate <<RbcGraphChanged>> when changes to the
on-screen coordinate mapping or plotted element geometry have been processed for display.
Applications can use this event to refresh information that depends on the displayed graph without waiting for pointer motion. Typical causes include:
Axis range changes, including zooming, panning, and stripchart automatic scrolling.
Widget resizing or layout changes that alter the plotting area.
Element data changes that require plotted geometry to be remapped, even when axis limits remain fixed.
The event is also generated for the initial mapped display. It is a notification that mapping work occurred, not a comparison of old and new coordinates: reconfiguration can generate an event even when the resulting axis limits or geometry are unchanged.
Geometry event delivery and data
The event is queued on the graph widget after its on-screen display pass completes. Delivery is asynchronous; it does not occur immediately inside the command that changes an axis or element.
Several changes handled by one display pass are combined into one notification. Changes requiring further display passes can produce further notifications. Applications must not assume one event per configuration command or data update.
An unmapped widget defers notification until it can complete an on-screen display with a usable plotting area.
No application data payload is attached to the event. Use %W to identify the graph and query its
current state. Because delivery is queued, that state may include changes made after the display
pass that queued the event.
For example, this binding records the current primary axis limits:
bind .g <<RbcGraphChanged>> {
    set ::graphView [dict create x [%W axis limits x] y [%W axis limits y]]
}
Scope
<<RbcGraphChanged>> is not a notification for every repaint. Exposure or focus redraws and
marker-only updates do not generate it unless coordinate mapping or element remapping is also
required.
Temporary mappings used for PostScript output do not generate this event. A subsequent on-screen display that restores or changes the screen mapping can generate it normally.
The event does not reposition ordinary graph markers or change the configured crosshair position. Applications implement any additional tracking behavior in their bindings. The graphtoolbar already uses this notification to refresh its enhanced crosshair annotations.
Event handlers should avoid repeatedly changing axes or element data in response to the notification: such changes can schedule another display and another notification.
Axis change notifications
Graph, barchart, stripchart, and polar widgets provide two axis events:
<<RbcAxisChanged>>reports successful axis configuration and changes to effective numeric limits. Configuration includes log/linear mode, descending direction, major/minor ticks, formatting commands, titles, colors, visibility, and other axis options. Reapplying an option with the same value also counts as configuration; the event does not compare every option’s old and new values.<<RbcAxisLimitsChanged>>reports changes to the bounds returned byaxis limits. These include zooming, panning, scrolling, and automatic limits derived from element data. Cosmetic configuration does not generate this event when the resulting numeric limits are unchanged.
Axis event delivery and data
Both events are queued on the graph after an on-screen display pass with a usable plotting area. An unmapped graph defers delivery until it can display. Each event combines all affected axes from that display pass; several commands before a redraw can therefore produce one event. Changes followed by a return to the previously displayed limits before redraw do not produce a limits-change event.
%W identifies the graph and %d is a Tcl list of axis names. Each name appears once; ordering is
unspecified. Hidden axes and named axes outside the margins are included. Initial display, and the
first display after creating an axis, announce its limits through both events. Deleted axes are skipped
when building the notification; deletion itself is not an axis-change notification.
The payload identifies affected axes, not an old/new snapshot. Query the graph for current limits and configuration. Because delivery is asynchronous, the current state may be newer than the display that queued the event, and an axis may have been deleted in the meantime.
proc RecordAxisState {graph axes} {
    foreach axis $axes {
        if {$axis ni [$graph axis names]} {
            continue
        }
        dict set ::axisState $graph $axis [dict create limits [$graph axis limits $axis] logscale [$graph axis cget $axis -logscale]]
    }
}
bind .g <<RbcAxisChanged>> [list RecordAxisState %W %d]
Axis queries, failed configuration, and temporary PostScript or snapshot mappings do not themselves generate these events. A later screen display compares the effective limits with the previous screen display. Data changes inside fixed bounds, marker updates, hover highlighting, and ordinary repainting do not generate axis events unless an axis is configured or its effective limits change.
These events do not report every change in tick-label placement or screen geometry. Use <<RbcGraphChanged>>
for mapping and layout updates, including resizing without changed numeric limits. Log/linear switching is
always covered by <<RbcAxisChanged>>, but only generates <<RbcAxisLimitsChanged>> if the resulting numeric
bounds change. Logarithmic bounds are reported in data units, just as by axis limits.
Copyright (c) George Yashin